
Advertisement
Advertisement
Natural Gas Price Forecast: Momentum Builds as $4.25 Level Comes Into Focus
By:
The recent breakout in natural gas has revived bullish sentiment, with Fibonacci targets and structural reversals signaling potential continuation toward multi-month highs above $4.25.
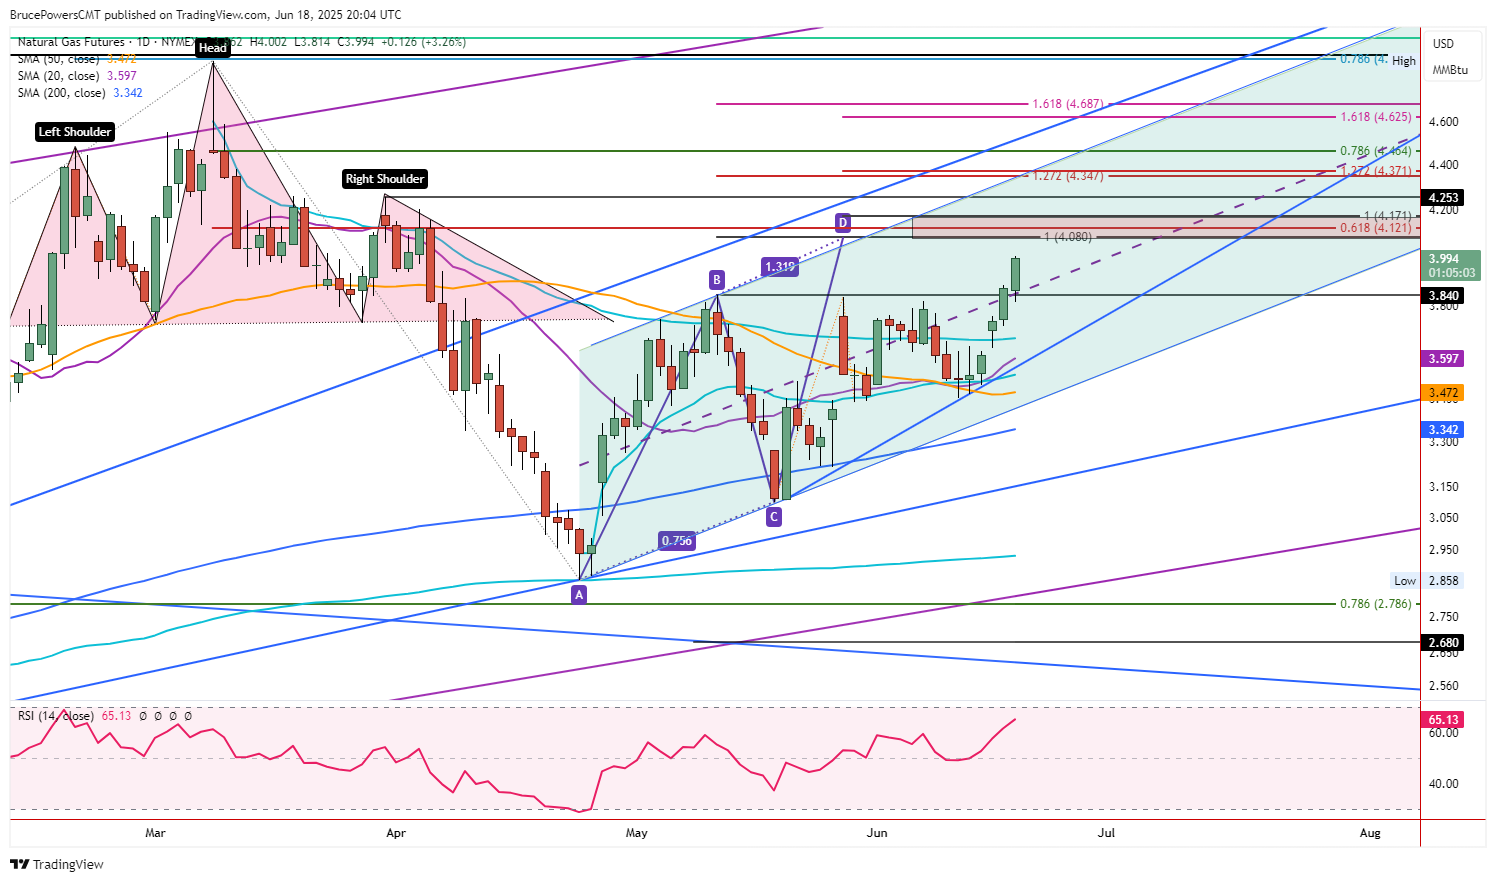
Natural gas continued to rise on Wednesday, following a strong bullish breakout above a nine-week high at $3.84 (B) on Tuesday. The breakout triggered a bullish continuation of a rising ABCD pattern that began from the April swing low (A) and breakout of a short-term rectangle pattern. Buyers remained in control on Wednesday as a new high of $4.00 was reached. At the time of this writing, demand remains strong with trading continuing near the highs of the day. It looks likely that natural gas will end today’s session in a similar bullish position.
Bullish Momentum Builds
So far, bullish momentum has improved following the breakout as indicated by the long green candles the past two days. The next target zone is rapidly coming into sight, ranging from $4.08 to $4.17. It includes the completion of two rising ABCD patterns and a 61.8% Fibonacci retracement. Nonetheless, a more significant price level is up at $4.25, as it is a lower swing high that established the right shoulder of a recent head and shoulders topping pattern.
Reclaiming that price level would trigger a bullish reversal signal as the price structure of the prior downtrend would be violated. A daily close above $4.25 would increase the chance of natural gas rising above $4.90, the 2025 high. If that price level can be exceeded, then there are two measurements pointing to a price zone from $4.35 to $4.37, as the next target.
Channel Points to Higher Targets
A rising parallel trend channel is shown on the chart with the low of channel established from two recent swing lows (A, C). Since natural gas has been rising from the lower channel line, there is the potential that it could eventually reach the top line before the current portion of rally is complete. That possibility increases the chance that the $4.35 price zone might be reached, as well as the 78.6% retracement at $4.46. Notice that the lower target would be hit before natural gas reached the top channel line.
Weekly 200 Moving Average Breakout
It is also interesting to note that the long-term 200-Week MA, now at $3.93, was reclaimed this week. Since the bearish trigger in early-April, natural gas has traded below the 200-Week line. There was an attempt to hold a breakout above that line starting in December, but it failed and led to the recent bearish correction. Prior to December, natural gas traded below the 200-Week line since January 2023. So, another reclaim could set the stage for a successful breakout.
For a look at all of today’s economic events, check out our economic calendar.
About the Author
Bruce Powerscontributor
Bruce has been involved in the financial markets for over 20 years, as an analyst, trader, educator, and writer.


Advertisement