
Advertisement
Advertisement
Natural Gas Price Forecast: Consolidates at Key Moving Average Support
By:
Natural gas held weekly support above $3.50 on Friday, with improving moving averages suggesting strength and potential for a breakout toward $4.08 in coming sessions.
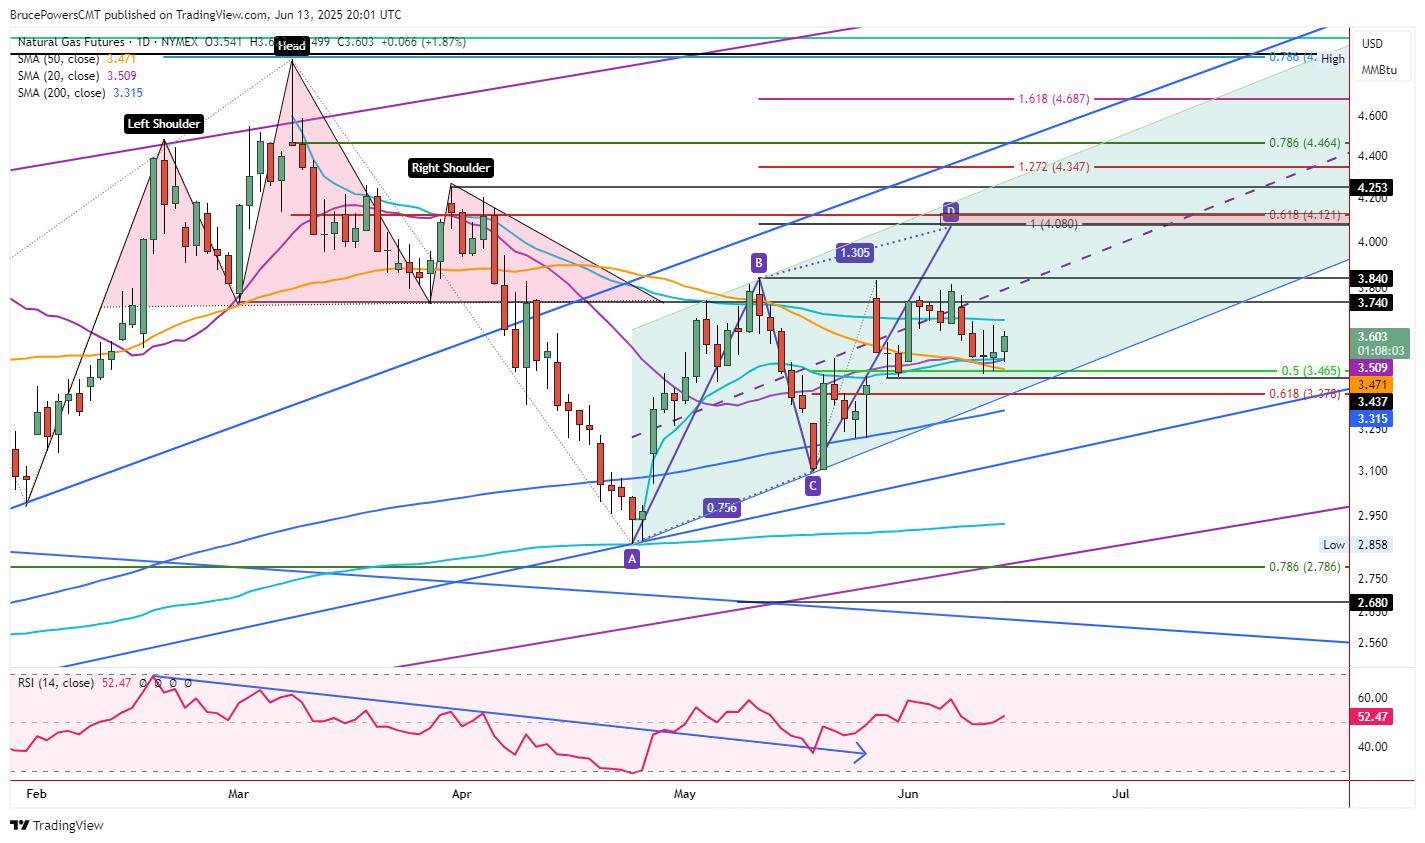
Natural gas continued to consolidate on Friday around support for the week. It traded inside Thursday’s price range, reaching a high of $3.62 and a low of $3.50. The low for the day was a successful test of support at the 20-Day MA (purple), which is at $3.51. That is a minor sign of strength along with the observation that that 20-Day line started to rise above the 50-Day MA (orange) recently after converging with it for a few days. This shows a recovery of both the 20-Day and 50-Day MAs after minor drops below them over the prior two days.
Failed Weekly Breakdown
Weekly support from last week was at $3.50 and it was broken on Wednesday. However, it was not confirmed with a daily close below that price level. Therefore, a weekly closing price above that level could be the sign of a false breakdown. Currently, today’s closing price will be above that price level and at a four-day closing high, another sign of strength.
Key Near-term Support at $3.44
Nonetheless, key support is at a minor higher swing low of $3.44, while this week’s low was at $3.45. If the slightly lower $3.44 level fails, the 61.8% Fibonacci retracement at $3.38 is the next lower target where support may be seen. Then, a little lower is the 200-Day MA, now at $3.32.
Watching for Breakout Above $3.62
A decisive breakout above today’s high of $3.62 could be the next sign of strength that has the potential to lead to higher prices. But the four-day high of $3.66 would need to be exceeded before there are clearer signs of a bottom. A recovery of the $3.66 level would establish a slightly higher swing low from this week. Solid potential resistance lies above and up to the $3.84 swing high from May. If natural gas can get above the May swing high, it has a chance to complete a rising ABCD pattern at $4.08. That price level is joined by the 61.8% Fibonacci retracement level at $4.12.
Above 200-Day MA is Bullish
Given the two recent bounces off the area around the 200-Day MA since April, the uptrend begun from the April swing low is expected to continue. That could change if there is a decisive decline below the 200-Day line.
For a look at all of today’s economic events, check out our economic calendar.
About the Author
Bruce Powerscontributor
Bruce has been involved in the financial markets for over 20 years, as an analyst, trader, educator, and writer.


Advertisement