
Advertisement
Advertisement
Natural Gas, WTI Oil, Brent Oil Forecasts – Oil Retreats As Traders Weigh The Impact Of Israel – Iran Conflict
By:
Key Points:
- Natural gas moved higher as traders reacted to bullish weather forecasts.
- WTI oil moved lower as traders focused on the reports indicating that Iran wanted to negotiate a deal.
- Brent oil declined towards the $73.00 level.

Natural Gas
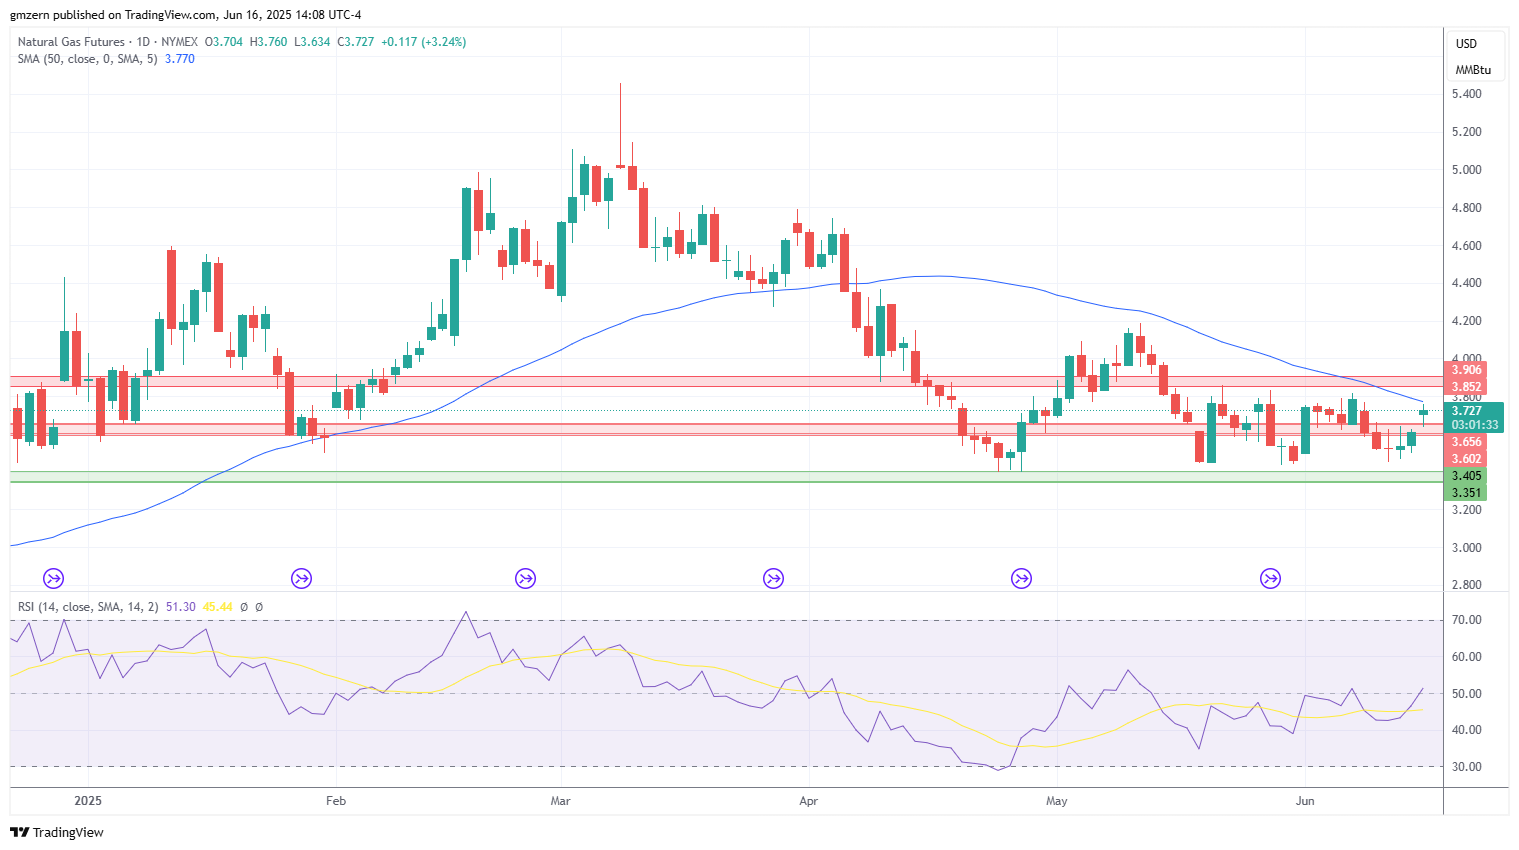
Natural gas gained upside momentum as traders focused on hot weather forecasts, which indicate that demand should increase.
A move above the 50 MA at $3.77 will open the way to the test of the next resistance at $3.85 – $3.90.
WTI Oil
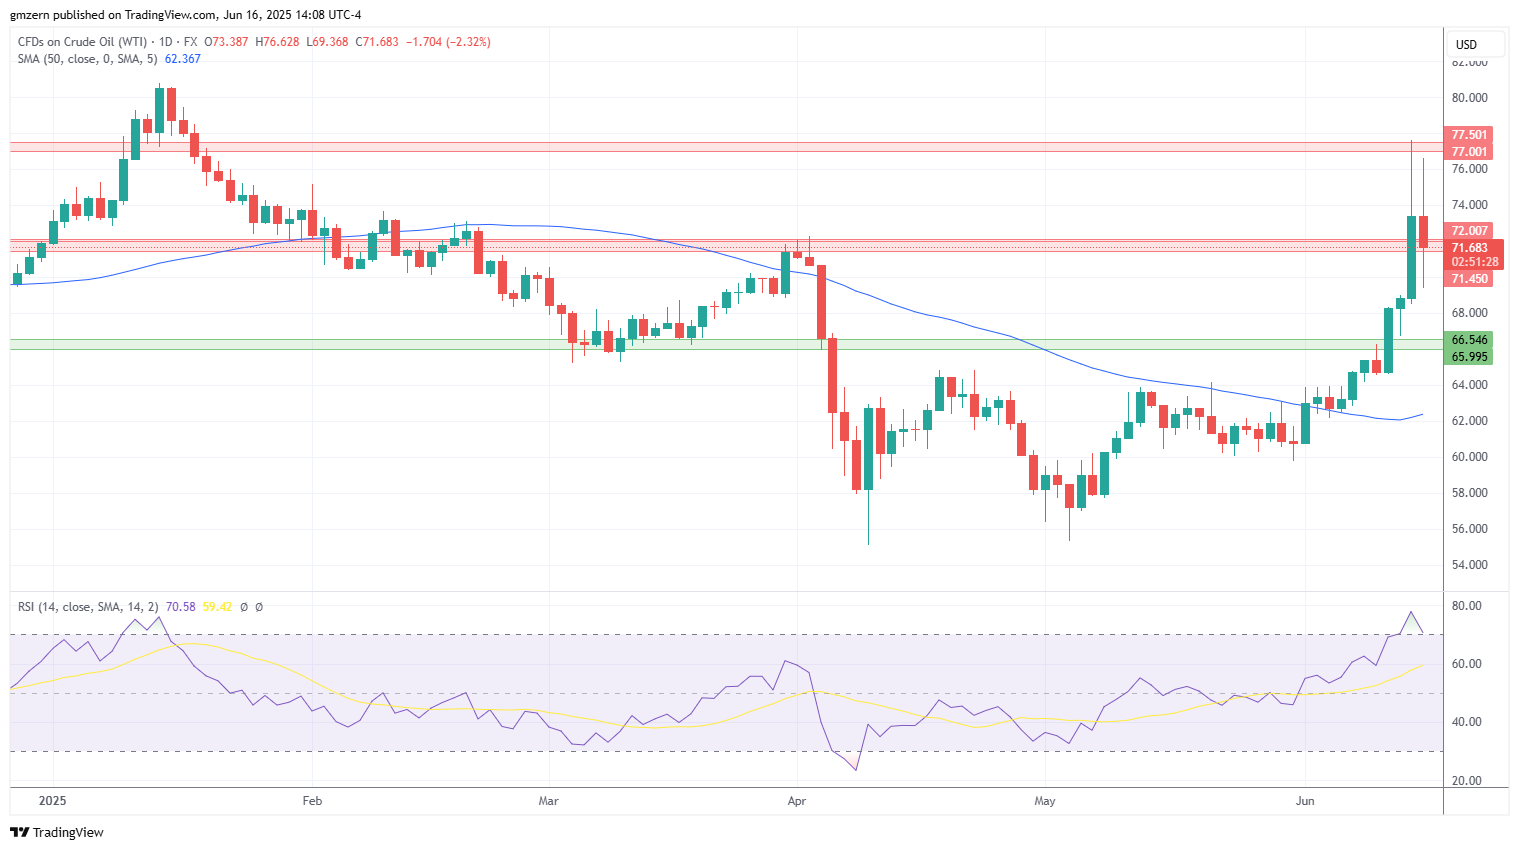
WTI oil pulled back amid reports indicating that Iran was seeking truce with Israel. It should be noted that these reports were not confirmed by Iran.
If WTI oil manages to settle back above the $72.00 level, it will head towards the next resistance at the recent highs at $77.00 – $77.50.
Brent Oil

Brent oil has also pulled back as traders evaluated that potential impact of Israel – Iran conflict.
From the technical point of view, Brent oil needs to settle above the resistance at $75.00 – $75.50 to gain additional upside momentum in the near term.
For a look at all of today’s economic events, check out our economic calendar.
About the Author
Vladimir Zernovauthor
In more than 15 years of trading in the financial markets, Vladimir dealt with a wide range of brokers and financial instruments. His career as a day-trader at a proprietary trading firm goes back to 2007. Later, Vladimir turned to longer time frames and became an independent trader and analyst managing his own portfolio. Using his experience, he helps traders find the best broker in his reviews.


Advertisement