
Advertisement
Advertisement
Natural Gas and Oil Forecast: WTI Struggles Below $72.15—Bearish Pressure Resurfaces
By:
Key Points:
- WTI crude hit $72.10 amid $8 price swings as geopolitical risks spark volatility in global energy markets.
- Natural gas futures rallied to $3.77 after breaking $3.72, signaling renewed short-term bullish momentum.
- Brent crude is holding near $73.29 but shows signs of stalling below $74.79 resistance, keeping traders cautious.

Market Overview
Oil markets remain highly sensitive to rising geopolitical instability, with WTI crude futures climbing to $72.10 per barrel on Tuesday. Price swings of up to $8 were recorded in Monday’s session as traders weighed the risk of supply disruptions to global energy corridors.
Natural gas also edged higher amid fears of regional spillover effects on infrastructure and logistics. Uncertainty around new tariffs and increasing OPEC+ output quotas adds further pressure.
Although some diplomatic signals have emerged, market participants remain cautious, reflecting a fragile balance between demand expectations and geopolitical risk premiums.
Natural Gas Price Forecast
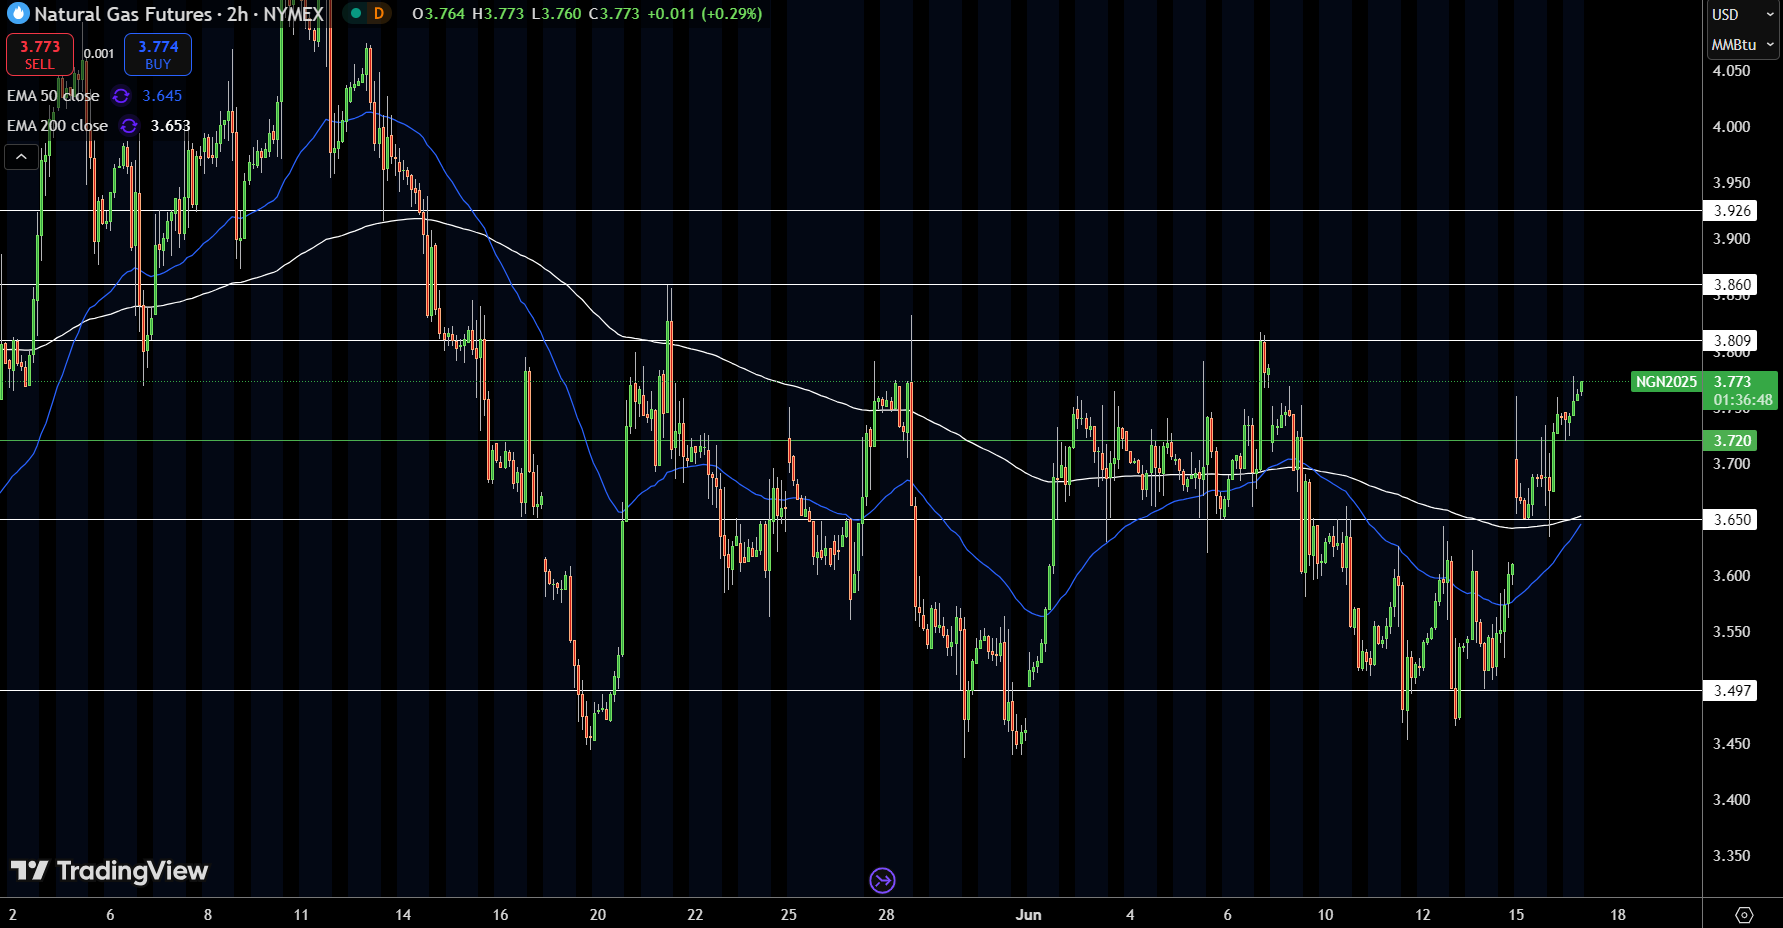
Natural gas futures are trading near $3.77 after breaking through the $3.72 resistance level, marking a shift in short-term momentum. The price has pushed decisively above both the 50-EMA ($3.645) and the 200-EMA ($3.653), reinforcing the bullish tone.
The next test lies at $3.809, a horizontal barrier that has capped price twice this month. A clean break above that could open the door to $3.86 and $3.926. Momentum remains strong, driven by a sharp rally from the $3.65 base and a recent sequence of higher lows.
As long as the $3.72 support holds, the path favors buyers. A failure below $3.72, however, may shift the bias back to neutral.
WTI Oil Price Forecast
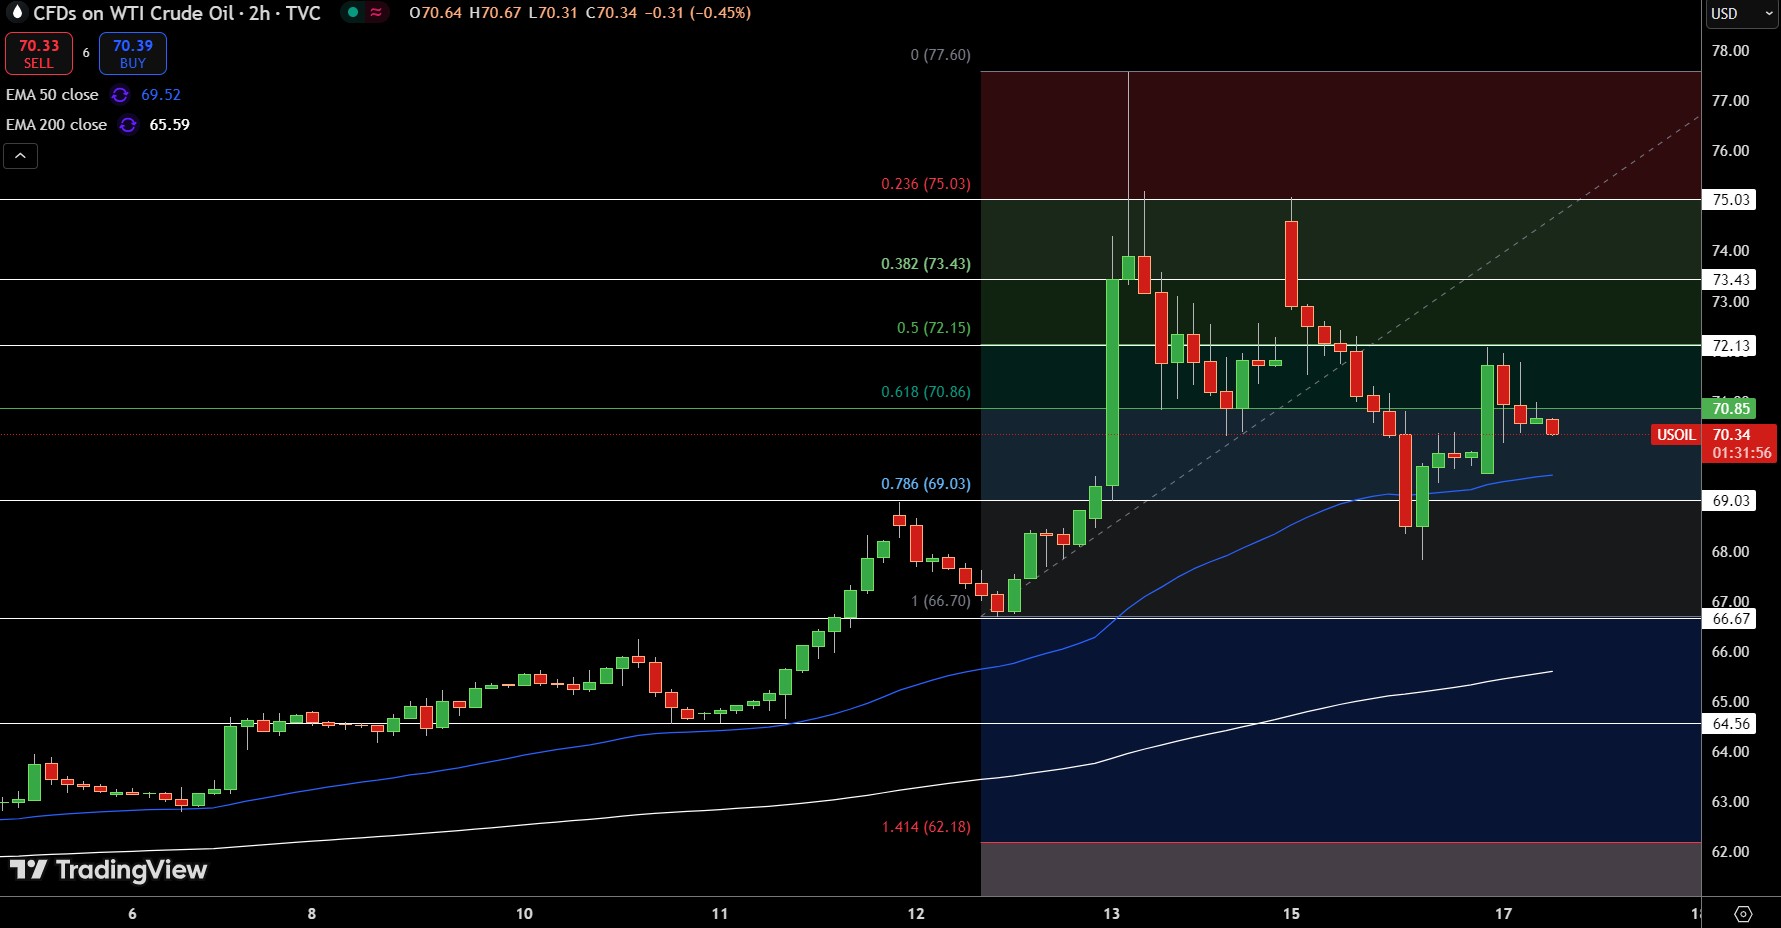
WTI crude oil is hovering near $70.34, slipping below the 61.8% Fibonacci retracement at $70.86 after failing to reclaim the $72.15 zone. The recent rebound off the 50-EMA ($69.52) lacked momentum, producing a narrow-bodied candle and showing hesitation near short-term resistance.
The price remains trapped between the 50-EMA and the 61.8% Fibonacci level, with a lower high structure emerging on the 2-hour chart. The MACD histogram is fading, indicating a decline in bullish conviction. A sustained move below $69.52 could expose $69.03 (78.6% Fib), while reclaiming $70.86 would be required to retest $72.13.
Brent Oil Price Forecast
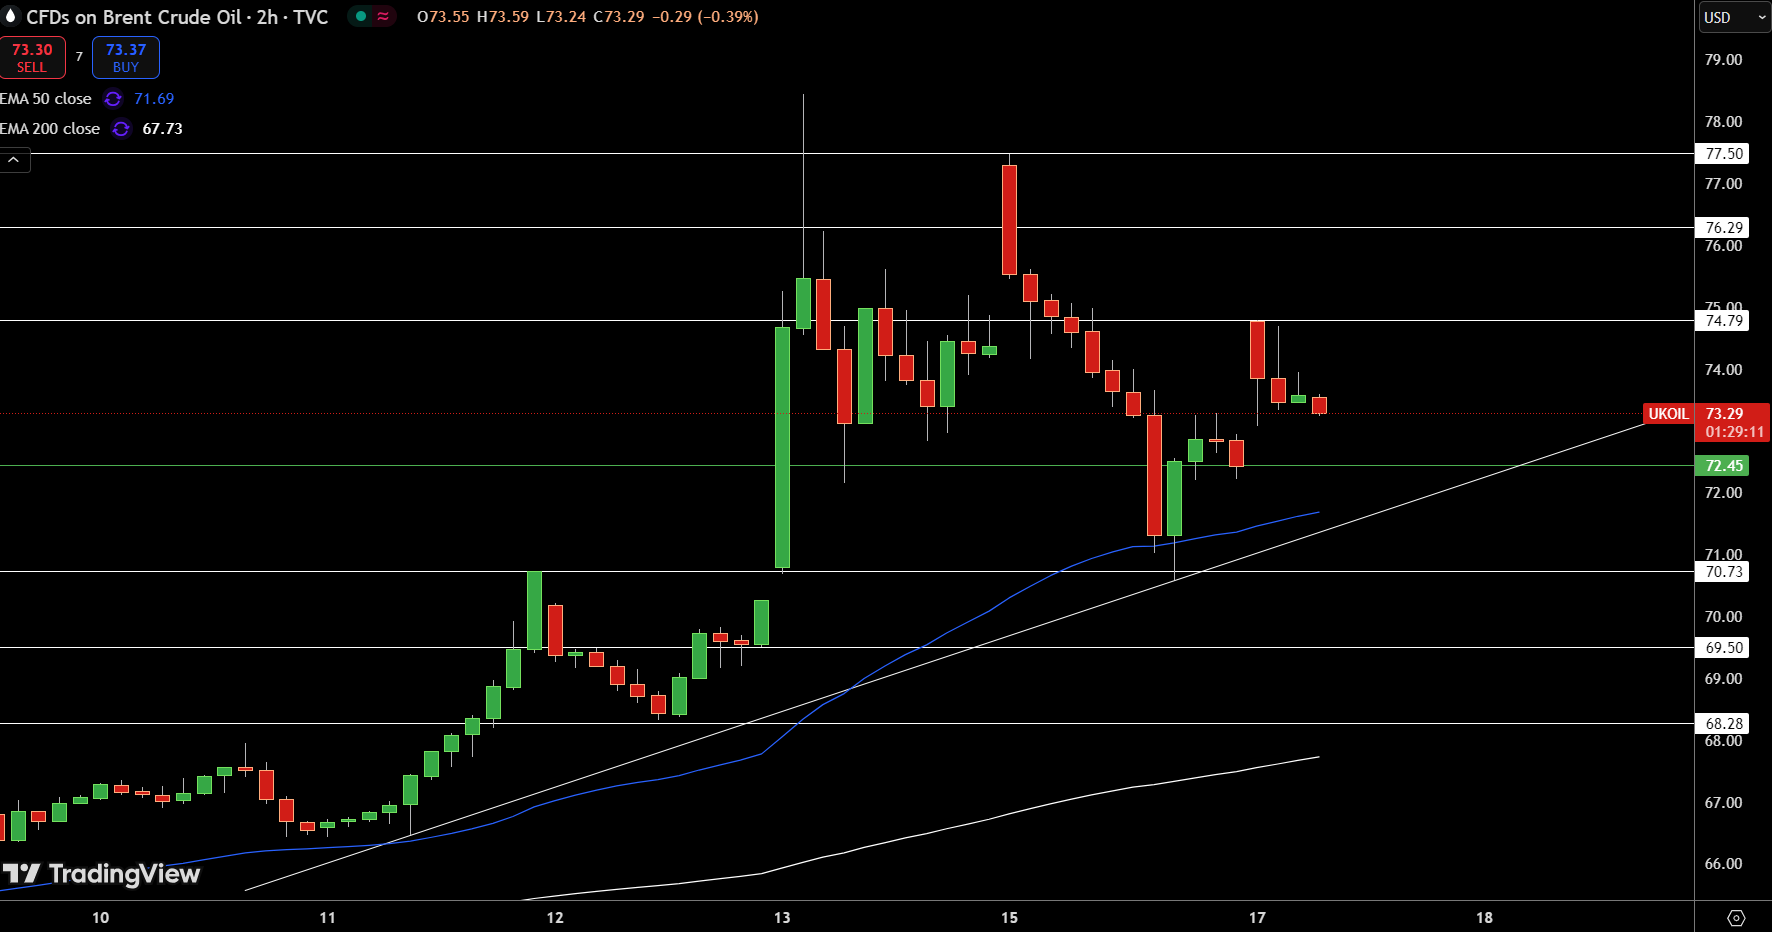
Brent crude is trading near $73.29, retracing modestly after a failed attempt to retest the $74.79 resistance level. The 2-hour chart shows the price bouncing from trendline support near $72.45, with the 50-EMA at $71.69 providing dynamic support.
Candles remain small and indecisive, reflecting a lack of conviction in either direction. The recent pullback hasn’t broken below the short-term support structure, but upward momentum has stalled. With no strong bullish follow-through, a break below $72.45 could create room to move toward $71.00.
Holding above this level would keep the uptrend intact, though a close above $74.79 is required to resume bullish momentum. The market remains range-bound for now.
About the Author
Bob MasonChief Crypto Boss
123456789 30 He has written extensively for a broader audience and his current focus is on developments relating to the financial markets including, but not limited to currencies, commodities, alternative asset classes, and global equities.


Advertisement